Member and Data Point Selection allow users to easily and intuitively select elements and data points for analysis directly from visualizations - in effect allowing the user to 'zoom' in on relevant data for analysis and offering users a powerful and fluid way to perform contextual ad-hoc analysis. Interactive Element (member) and Data Point selection capabilities extend the capabilities of the more comprehensive element selection capabilities in element trees and / or the Elimination Wizard.
There are two variations in the functionality depending on how the it is triggered and the target items:
- Member (Element) Selection: This capability involves selecting (or eliminating) one or more hierarchy elements using the "Focus" and "Eliminate" menu options. This capability is a shortcut for the capabilities found in element trees. It can also optionally be implemented through the Elimination Wizard - which keeps track of any actions performed through the context menu.
- Data Point Selection: This capability involves selecting (or eliminating) one or more data points from a query using the "Focus Data Point" and "Eliminate Data Point" menu options. Intrinsically, a data point is a COMBINATION of elements - and it can only be implemented through the context menu functions (described in this topic) or using the Eliminations Wizard. This type of capability cannot be done through the element trees.
The commentary in the Elimination wizard expands on these concepts further. The techniques for making simple selections and multi-selections on visuals is described below, and covered in-depth here.
Using Selections
Member Selection: Focus and Eliminate
Interactively selecting members or elements, is a fast, direct and effective technique to focus the report on the key elements driving results. Likewise, eliminating members is a fast and effective technique for removing specific 'noise' from the analysis.
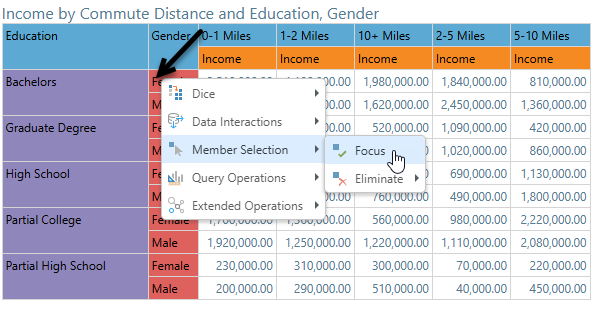
To eliminate members, simply right-click on the member (in this case we right-clicked on 'Female'), choose Member Selection and then choose to 'Focus' on it or 'Eliminate' it.
If the axis that contains the member has two or more hierarchies (in this example it contains Education and Gender), then the Eliminate option will include a fly-out where you can choose to eliminate just females (the default) or the combination of bachelors and females. As mentioned, you could focus and eliminate the 'Female' element from the element trees, but the ability to eliminate the combination of 'bachelors and females' can only be done through the context menu or the Elimination Wizard.
See below for guidance on how to focus or eliminate multiple members.
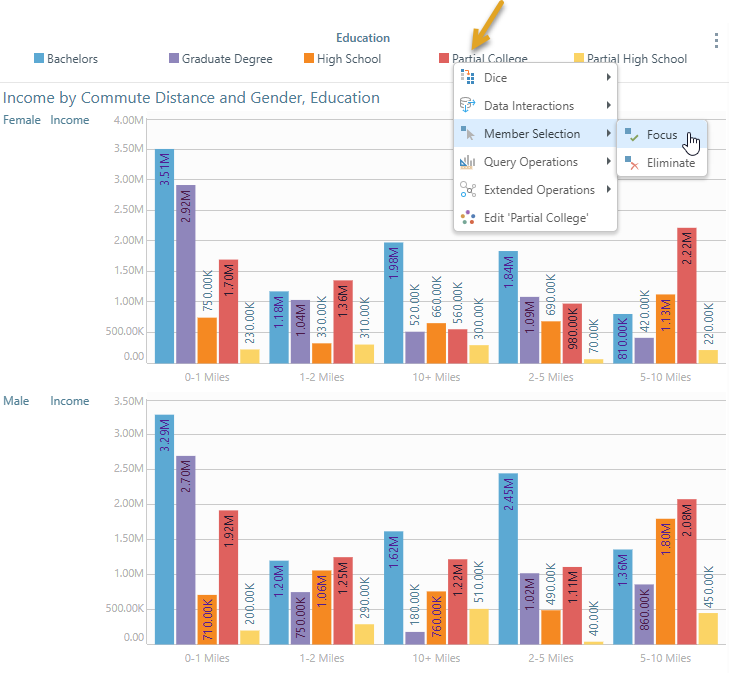
This functionality can operate off chart axes like the columns and rows of a grid as well as off the legends attached to any visualization. For a legend, right-click on the element label (orange arrow below), select Member Selection and then click Eliminate or Focus.
Focus and Descendants
If you are using a multi-level OLAP or 'Regular' hierarchy, the Member Selection menu offers the ability to focus on the current element item and show all its descendant child elements in a single click using the 'Focus and Descendants' function.
- Click here for more details on this specific feature.
Note: You CAN use member focus or eliminations with Totals.
Focus and Eliminate Data Point
Like member-only selections, interactively selecting cells or data points is a fast, direct and effective technique to focus the report on the key values driving results. Likewise, eliminating data points is a fast and effective technique for removing specific 'noise' from the analysis. As mentioned, data point focus and eliminate is only available using the context menu or Eliminations Wizard.
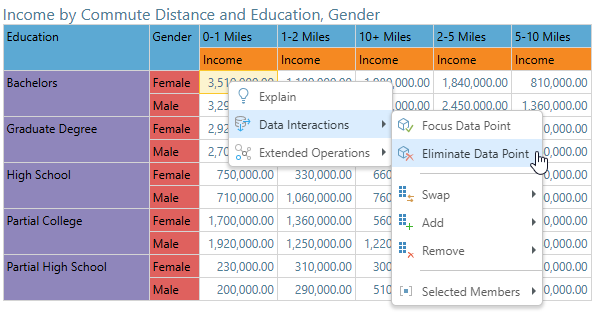
The same effect can be achieved on data points or cells. Right-clicking on the highlighted cell in a grid lets us Focus on or Eliminate the selected data point. In this case, the data point representing Females with a Bachelors Degree, who have a commuting distance of 0-1 Miles:
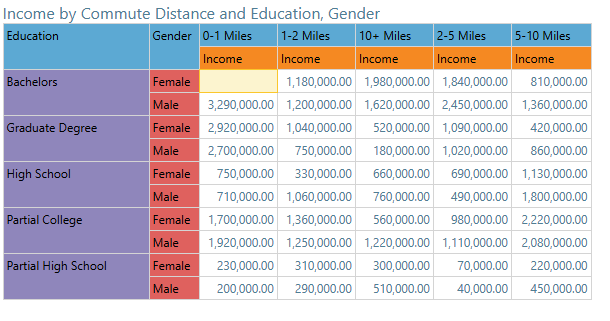
In this case, we chose to eliminate the data point - and you can see the item has been removed from the query.
Tip: You can revert your elimination, adding the eliminated value back in to the discovery, by (1) clicking Undo (if you are in the same session), (2) opening the Elimination wizard and Removing the elimination from the Elimination Settings, or (3) selecting Eliminations > Remove Eliminations from the Query Ribbon.
Note: You CANNOT currently use data point eliminations together with Totals.
As mentioned, the ability to focus or eliminate a combination of items (a 'data point') can only be done through the context menu or the Elimination Wizard. See below for guidance on how to focus or eliminate multiple data points.
Multiple Selections
Member and Data Point actions may include eliminating more than one item for a given report or visualization. As such, the ability to then perform these actions across multiple selected items at a time becomes very important. Pyramid offers the following options for selecting multiple items, depending on the visual and the features visible for the given visualization type:
- Item picking: Using
CTRL+clickor the Item Picker tool to select non-contiguous members or data points one-at-a-time. - Lassoing: Using the Select Lasso or Zoom Lasso (where available) tools to select a contiguous set of members or data points.
Either technique selects the items. Once selected, you can right-click and choose the relevant operation to perform from the context menu, for example, focus or eliminate.
- Click here for more information about this functionality.